
2020 Census Data Tool
An interactive feature examines how various risk factors could contribute to inaccuracies in the 2020 Census, potentially leading to miscounts in states and among historically underrepresented demographic groups.
2020 Census Data Tool
An interactive feature examines how various risk factors could contribute to inaccuracies in the 2020 Census, potentially leading to miscounts in states and among historically underrepresented demographic groups.
Role
Design Lead
Deliverables
Vision & Strategy, Research, UX, UI, Interaction Design, Product Design
Agency
The Urban Institute

The problem
Are concerns about miscounts in the upcoming 2020 Census reputable, and if so, what could drive these miscounts?
The decennial census, which aims to count every US resident each decade, is critical to our democracy. It influences congressional representation and funding decisions at all levels of government. However, the 2020 Census faced unprecedented challenges that threatened its accuracy. Anticipated demographic shifts over the preceding decade made the population harder to count. Meanwhile, underfunding, untested process changes, and the last-minute introduction of a citizenship question risked reducing the political influence and resources of community officials. These challenges underscored the urgency of assessing and addressing potential miscounts before the census took place.
The vision
Design an interactive tool that enhances public understanding of the census and highlights the profound impact that counting challenges can have on states and demographic groups.
Discover and define
To anticipate the potential impact of counting challenges in the 2020 Census, our team developed projections across three scenarios—low, medium, and high miscount risk—offering a clearer picture of the possible scale of an undercount. We developed an interactive data feature with an effective outreach strategy to ensure accessibility and visibility for a broad audience.
The tool needed to be intuitive for non-technical users while also serving as a valuable resource for data-savvy stakeholders. To meet this dual need, we employed a tiered content approach, allowing users to explore census data at different levels of depth depending on their expertise.
Prototype and test
My designs created a clear hierarchy, weaving the 2020 Census’s unique story with interactive data. Users could filter results by state or demographic group to see who was most at risk of being miscounted.
For large screens, I brought the human element to life through illustrations, color, and user-friendly language, ensuring that these data points represented real people with real stories. A state view mockup provided a tile map of the US, allowing users to grasp the broader picture before diving into specific states.
Data personified
While hard numbers were critical, it was equally important to emphasize the sensitive and often emotional nature of the census, underscoring that these data represent more than cells in a spreadsheet.
Strong visuals and accessible language played a key role in humanizing the numbers and reinforcing the significance of an accurate count.


Given our diverse audience, responsive design was a top priority. Many users needed a tool that was easy to scan and digest on mobile. My mobile design used filterable and sortable content cards, ensuring accessibility without sacrificing depth.
Final product
Results and impact
This project elevated the census debate and raised the profile of Urban Institute experts.
Eighteen months after its launch, it continued to receive media and stakeholder attention, and it remains an essential resource for understanding census accuracy and its implications today.
We strategically timed the release of the tool and accompanying report just before the census printing deadline and the Supreme Court’s citizenship decision. This timing amplified the tool’s relevance in the national conversation and helped local organizations push for an accurate count in their communities.
By clearly answering one key question—how an undercount could impact states and demographic groups—this project showed how a well-designed data tool can make a meaningful impact.
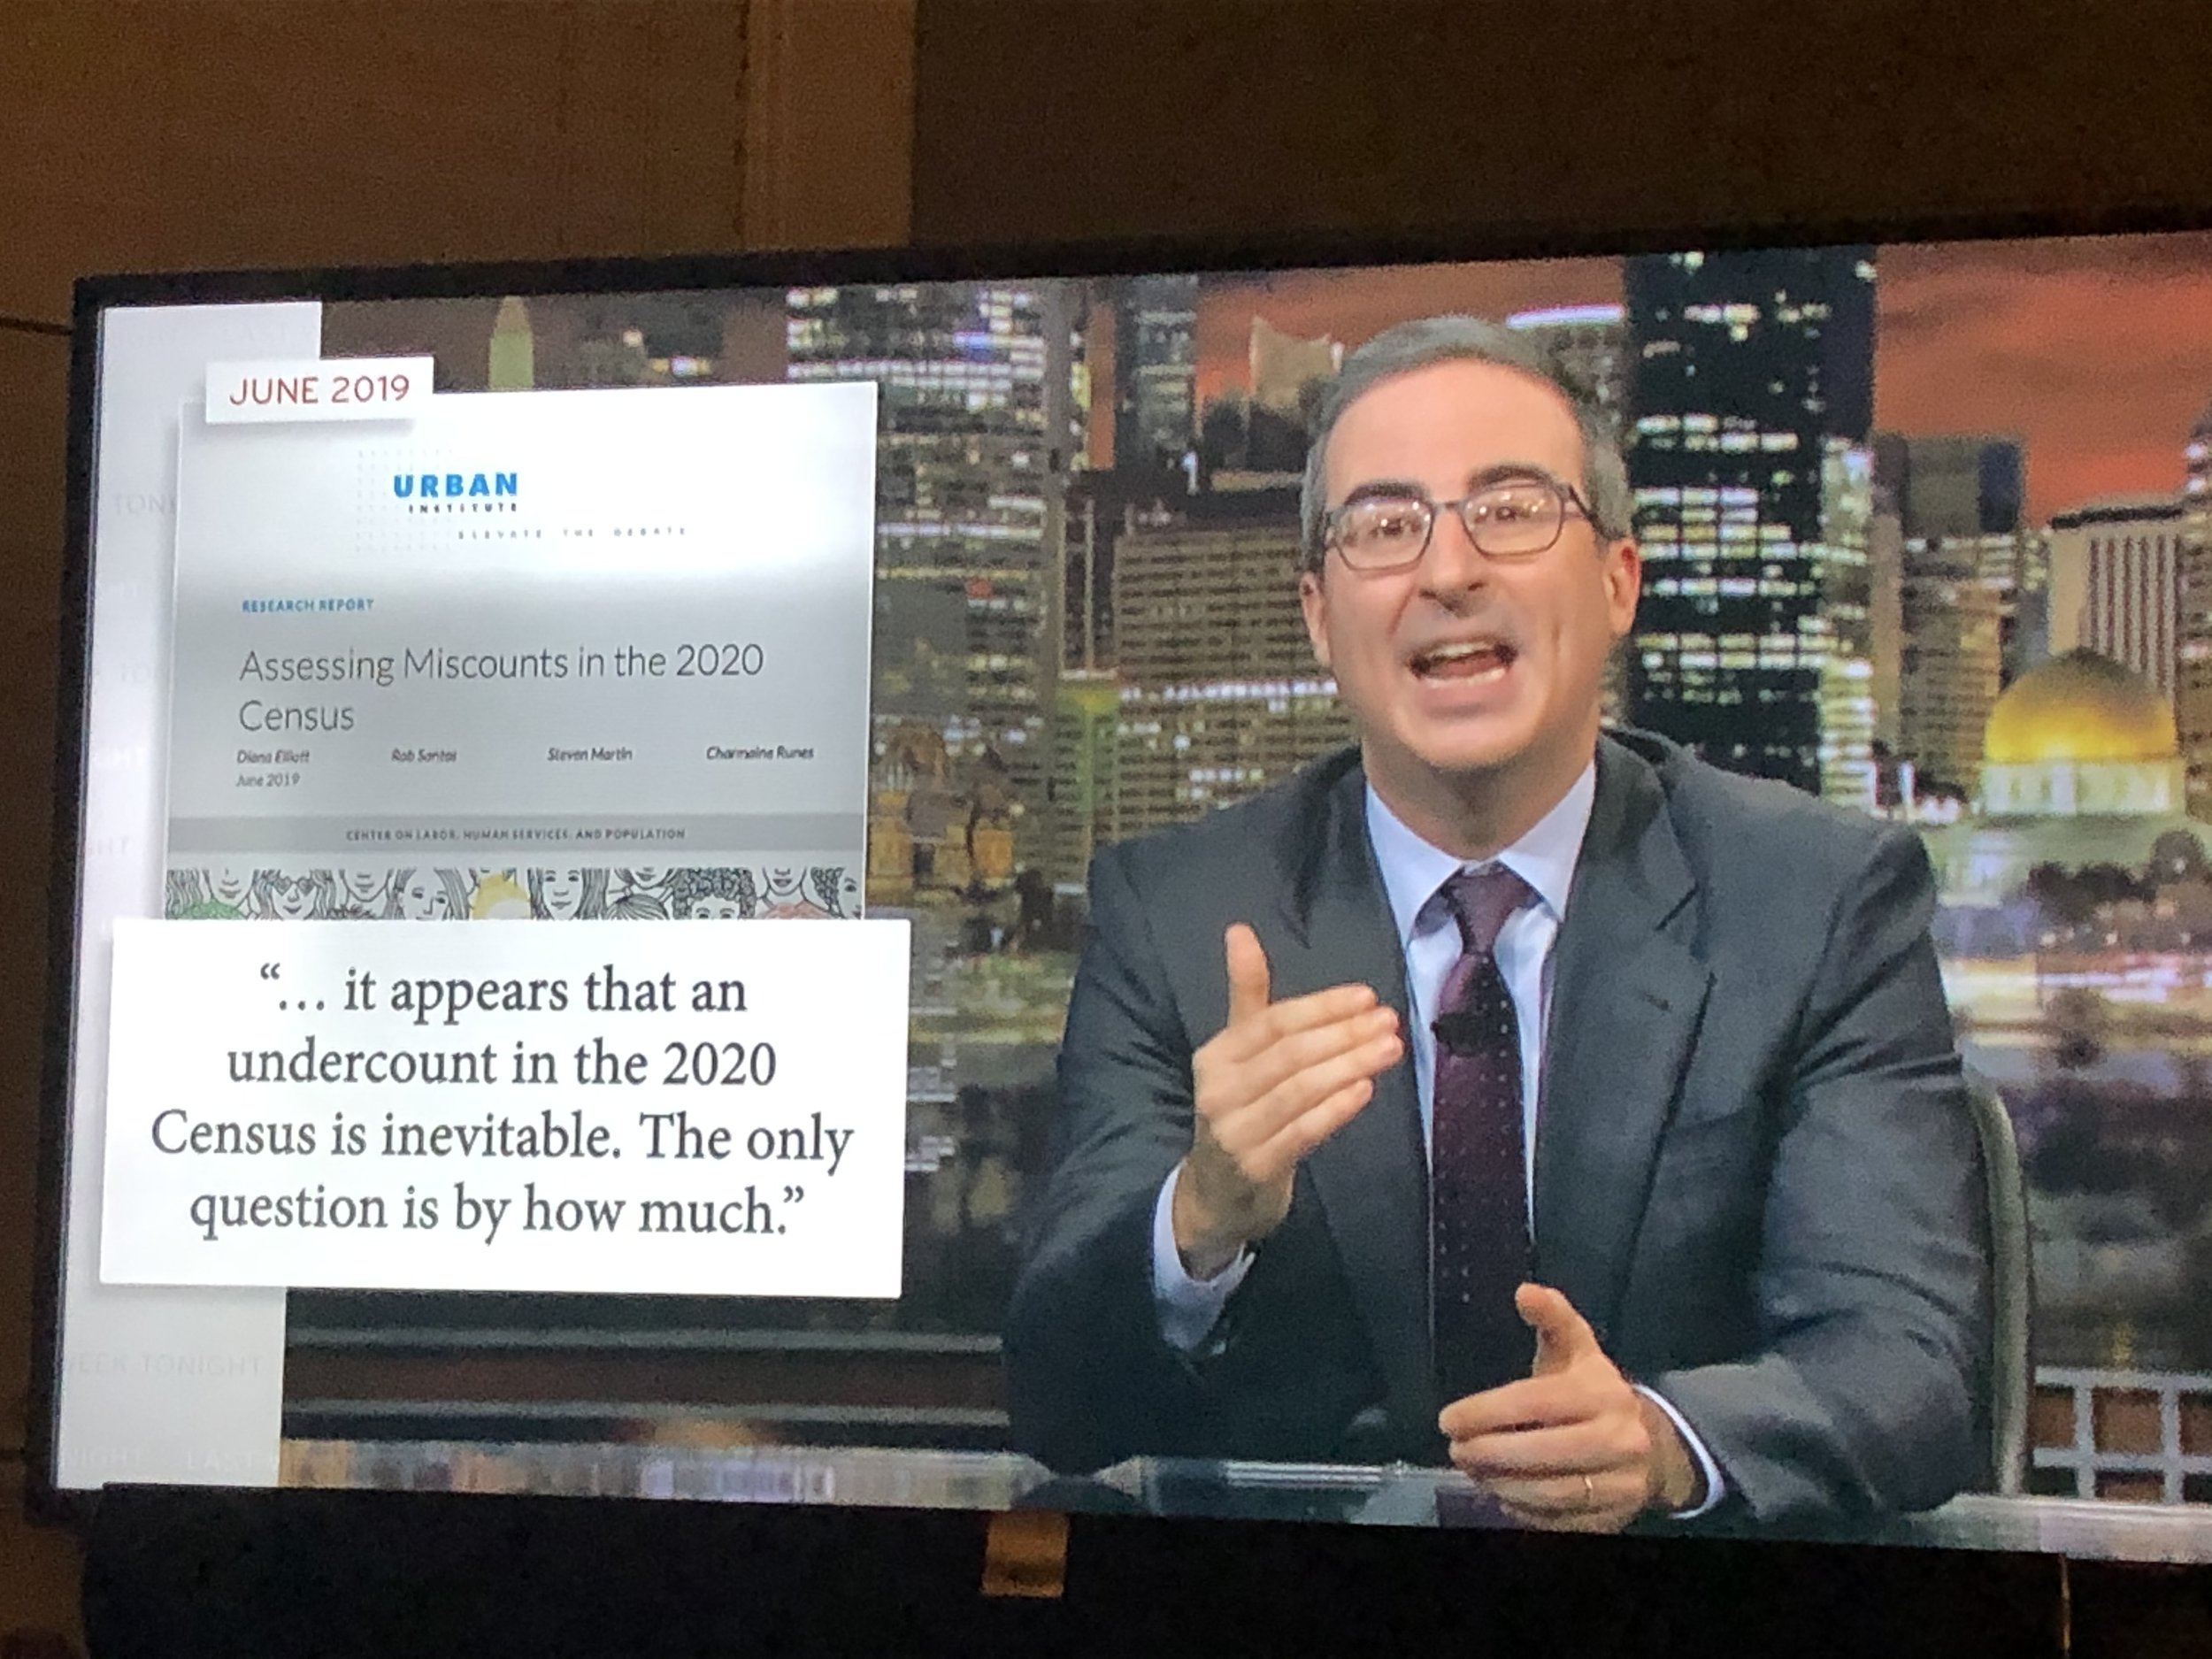
An excitedly and hastily-snapped shot by my boyfriend (now husband) after the tool’s release.
Media and press attention (at time of June 2019 release)
13,000+ page views.
Cited over 1,400 times in major media outlets, including in the Associated Press, Axios, BBC, Bloomberg, CBS, CNN, The Guardian, HBO’s Last Week Tonight with John Oliver, MSNBC, NBC, the New York Times, Newsweek, NPR, PBS Newshour, Politico, Telemundo, Univision, VICE, Vox, the Washington Post, and many more state and local media outlets.
Significant social media attention, with tweets from Kamala Harris, NYT Opinion, and the US Committee on Education & Labor.
We built this feature with media audiences in mind, ensuring the tool was easy to use and allowing users to find personalized insights within the data. The surge of visits, shares, and conversations demonstrated that we successfully reached our intended audience. By prioritizing media outreach, we placed our findings in front of policymakers and community groups working to bolster census outreach efforts.
Driving success through cross-functional teamwork
The Urban Institute’s build and outreach teams collaborated from the start to create a product tailored to the target audience.
The research, design, development, and outreach teams worked closely for months, leveraging their strengths to build the best possible product. Prioritization, clear communication, and mutual trust ensured we completed the tool on time and met its objectives, delivering a lasting impact in the national conversation on census accuracy.